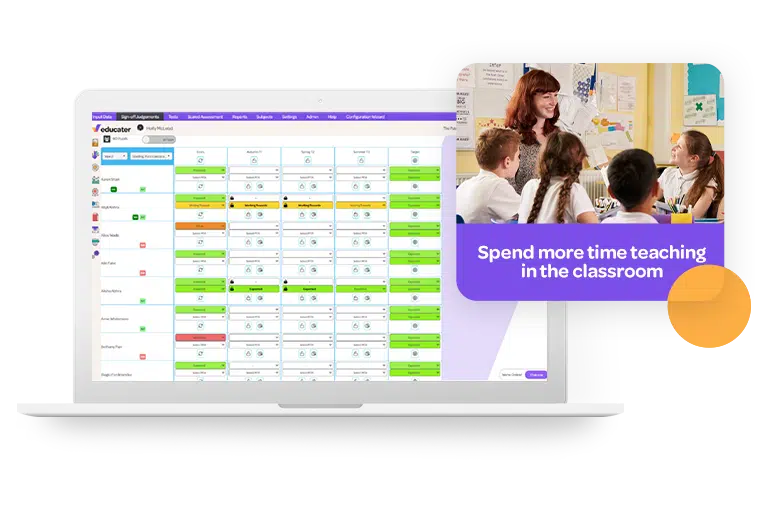
Educater is a flexible assessment tracking solution that helps educators track pupil progress and improve learning, through powerful data entry and analysis tools that also reduce teacher workload.


"The system was able to be more bespoke for our needs as an international school, than other assessment systems on the market."
Sign yourselves up! The team are phenomenal and are always a huge help!
Jamie Atkins I Nord Anglia The British International School Abu Dhabi

“Educater allows schools to tailor the system so that it works effectively to meet specific needs.“
This was particularly useful when embedding our approaches to the assessment SEND children.
Laura Trelfa I Micklehurst All Saints CE Primary School
“I have really enjoyed working with Educater to get all our assessment frameworks onto one system"
Working in a SEN school with students aged from 11-19 has meant we needed a system that can include students working on the engagement model all the way to secondary school.
Bradley Jowitt I Seven Hills School
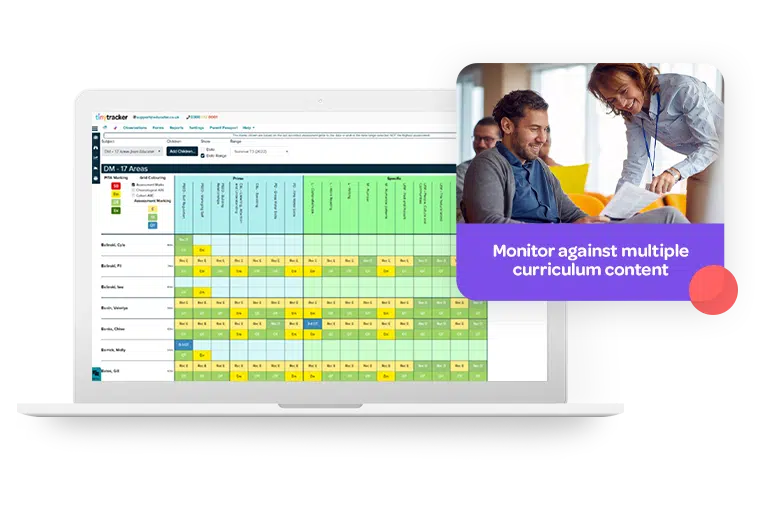
“Educater has allowed us, as a school, to use a platform to log, monitor and track pupil’s progress, assessments, test scores, gaps in learning and many other features."
Being able to customise our own grids has also been a great facility for us to use and develop across our curriculum.
Emma Williams I Whitby Heath Primary School

"Before using Educater we used a paper-based system which was bulky and had to be passed from year to year."
We have been able to adapt the system in order to track and monitor progress of all of our pupils from KS1 through to post-16.
Mikaela Chapman I Stone Hill School
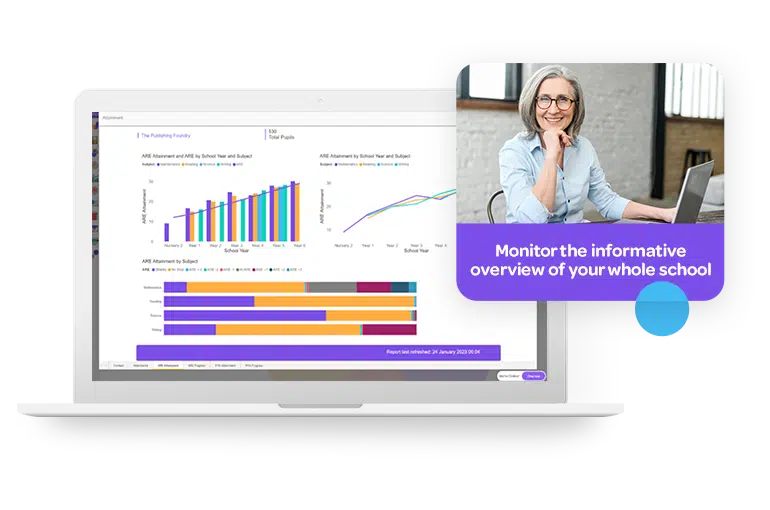
“Assessment data is effortlessly analysed with reports produced in a variety of formats at the click of a button."
All key groups are easily identified, allowing the impact of interventions to be reviewed and evaluated.
Mark Dakin I St Giles' CE Primary School